Scraper for CI data
Develop an ETL process for scraping data from Jenkins Builds (build time, agent usage, test errors, flaky tests, etc.) and a consumer application for producing dashboards and metrics.
Problem Description
CI has become a bottleneck for delivering tasks, specially in BOS, due to te time and resources it consumes, and also because of the lack of confidence introduced by flaky tests.
In addition, flaky tests are a problem on their own, because some times it could be exposing a problem in the system under tests rather than in the tests.
However, we lack well defined metrics and reports to attack the problem in both CI verification time and test flakiness.
Background
Over the last months, @david.arch and @luis.piedra have been developing some scripts and tools for scraping useful data from executions in Jenkins, specifically for BOS CI project. While the scripts are producing interesting results individually, it is difficult to share them or to collaborate in the development.
In addition, due to storage and performance limitations in Jenkins Server, we cannot store the executions in Jenkins indefinitely. We store logs for releases and deployments, but not for each individual execution on each verification. For that purpose, we have been using local storage, but a shared persistance would be needed if the scripts and tools needs to be shared.
Jenkins provides several metrics plugins and integrations:
- Prometheus
- InfluxDB
Both of them can later be used for producing dashboards in Grafana. However, the metrics seems well suited for linear pipelines no spinning multiple EC2 instances on each execution, and we are not getting good dashboards with current available data.
InfluxDB plugin has more complete data, specially regarding test results, although first attempt for using them resulted in parsing error, apparently due to test suite name containing spaces. Prometheus does not offer metrics on tests execution beyond the total tests and number of failed tests, without further detail.
Prometheus offers better insights on build times for each individual stage, but metrics becomes messy and inaccurate when the pipeline has multiple parallel and nested stages. Metrics regarding build times are of the Summary Type but without percentiles included.
In addition, none of the plugins offers good data regarding queue time and agent specific usage for a given size, which are key metrics for optimizing our current setup (which metrics are useful are really dependant on the base setup, and ours will be very specific to the way we use EC2 Plugin in Jenkins. If we migrate at some point to ECS or K8S based infrastructure, probably some of our needs would be different).
Another limitation in the plugins is that they will offer the same metrics for all the workloads in Jenkins, while we have very different workloads for each project (most likely, BOS need different metrics for its pipeline than a microservice). Also, the way we identify Flaky tests in BOS in the case of test retry, which is very ad hoc for our project.
Solution
Build metrics
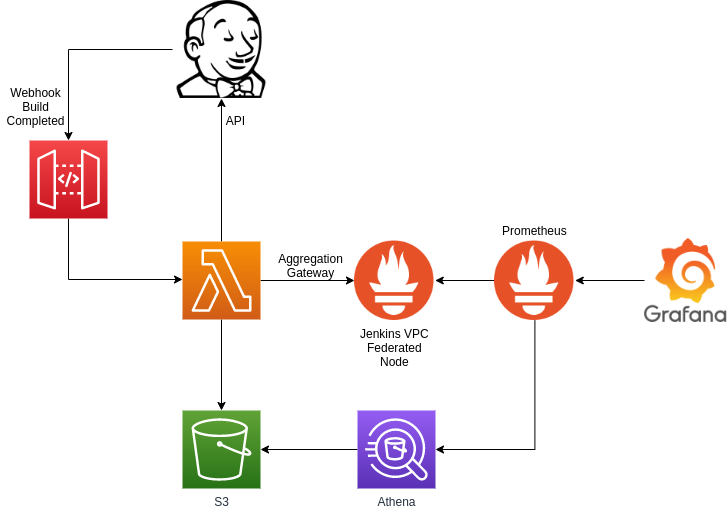
On each build completion, Jenkins will trigger a webhook using this plugin https://github.com/jenkinsci/outbound-webhook-plugin. The webhook will include in its payload a reference to the build, so its details can be queried with API calls.
The webhook will trigger lambda functions that, using the currently available scripts, will query Jenkins for extracting data from the completed build.
In those lambda functions, build from the API can be processed and normalized. As it is a custom logic, conditions can be implemented for having different processors for different types of builds.
Once processed, metrics will be pushed to Prometheus using Aggregation Gateway (https://github.com/weaveworks/prom-aggregation-gateway/)
We can also store test results in S3 for later query with Athena.
Agent metrics
Current metric plugins in Jenkins offer support for total number of busy and available agents, but it is not possible to retrieve specific data segregated by agent capability.
In order to have those metrics, we will follow a more classic approach
using a exporter presenting metrics for the agents at /agents_metrics
endpoint.
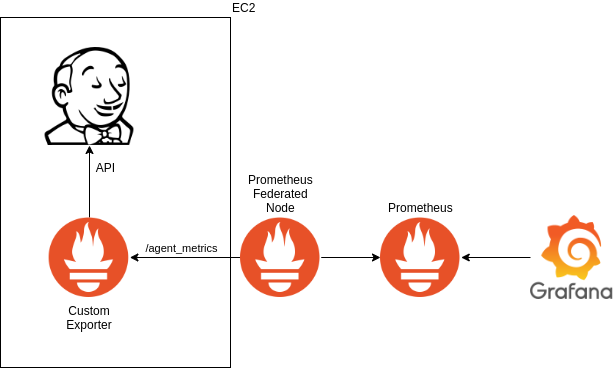
The exporter will be based on https://github.com/lovoo/jenkins_exporter with the concepts shown in https://www.robustperception.io/writing-a-jenkins-exporter-in-python
Available metrics
The following metrics will be available
Build
- Duration histograms
- Total
- By result
- Agent usage
- By label
- Build result
- Success
- QG Fail
- Error
- Aborted
If the pipeline is composed by multiple sequential stages, metrics can be available also for each individual stage.
If a stage is composed by parallel stages, metrics can be available for each parallel stage.
Queue
- Queue time
- Total
- By agent label
- Blocking queue time
- Total
- By agent label
Tests
- For each test
- Test success
- Test fail
- Test flaked (success after re-execution)
- Test duration
Agents
For each label, there will be gauges with
- Agents busy * Agents available * Maximum agent count
Alternatives
Use a exporter instead of aggregation gateway
The problem with exporter is that we would need to query Jenkins API for all the builds available in Jenkins for every job and branch, and that is both time consuming and heavy processing for the Jenkins server.
The idea behind the lambda and push gateway is to query Jenkins every time a build is completed, and query for details for only that build. However, we could also use caching for build results, resulting in less complex infrastructure at the cost of more complex scraper.
Use jenkins available plugins
We have found current available plugins lacks most of the data we are looking for. They are also buggy when it comes to complex pipelines, specifically when it relates to queue time, and they lack aggregation by agent type or size.
We will still left the Prometheus plugin activated, with our Prometheus server scrapping data, so it will be still possible to create dashboards from there if somebody finds it useful. It also offers some great insights regarding Java Virtual Machine which will be really useful.
Regarding InfluxDB plugin, it would require additional component and infrastructure, and still lacks most of the metrics we seek.
Contribute to Jenkins plugins
Given the degree of freedom Jenkins allows in building both pipelines and underlying infrastructure, it is really hard to find a general solution.
Contributions would have a lengthy acceptance cycle. We could maintain a fork, but it has additional nuisances and there is not support for deploying forks in our current Jenkins infrastructure as code.
Most importantly, embedding metrics with the plugin will mean coupling it with the current server, each update in the code will need update in Jenkins and restart for the service.
Django or Flask application
Develop a small web application that, using a ETL process scapes Jenkins API for execution details and stores it in a small database. With that database, create dashboards for visualizing data for a given time range.
The main advantages would be to hold historical detailed data for executions, and that the scripts for both scraping and publishing metrics are already developed.
Kibana
Instead of using Jenkins API for scraping data, the same data can be found in both build logs and Jenkins server logs.
However, none of those logs are currently being sent to ELK, and the current status of ELK in development account is not particularly friendly or stable. An RFC for a full logging platform is ongoing.
Operation
Produced dashboards are intended for SRE team, CI squad, Automation Team, and in general to any team that is running a pipeline in Jenkins and is interesting in optimizing its execution.
Automation team and development teams will be consumers for the data, and it will be possible for them to include new dashboards an queries. CI squad will be responsible for the lambda function scraping and creating metrics.
Security Impact
Data presented in the application dashboards shall not be confidential, but internal. Access will be allowed only through VPN.
Credentials for accessing Jenkins API must be retrieved from AWS Secrets Manager.
Access to AWS resources (such as storage) will be granted by IAM role specific to the lambda function.
Performance Impact
Application will be scraping data for completed builds, so it will have no impact in running pipelines.
However, extensive API calls may cause Jenkins to load in memory a big number of objects that otherwise would be stored on disk, then causing increase in memory usage and multiple calls to garbage collector.
Developer Impact
N/A
Data Consumer Impact
This is new application and new data set, so no consumer can be impacted yet.
Deployment
Process is defined to be Serverless. AWS resources will be created with Terraform along with the current Jenkins infrastructure, and it will be possible to replicate it if we include more Jenkins servers in our setup.