Predictive maintenance (Watchdog CI)
The following document describes the design and implementation of an automatic maintenance system for the company's continuous integration systems. The idea is based on industrial predictive maintenance systems.
Problem Description
As the number of quality gates and tests grows in continuous integration (CI) systems of large projects like BOS, maintenance becomes more complicated and expensive. A manual maintenance system usually works when the failure has occurred too late and is affecting other users.
If we analyze the numbers of the last 100 executions of the BOS CI in the 'dev' branch, the 2% are failures (red color) and 30% are flaky test failures (yellow color). The percentage of flaky tests in BOS is 3% and we add about 500 new tests per month. We can expect to include about 15 flaky tests per month, therefore, it is necessary to carry out system maintenance.
Some consequences of this situation are, increased costs, loss of confidence, delay in delivery times or saturation of hardware resources.
Background
Following the progress and new decisions on the Flaky test project, we have agreed that we will no longer use a quarantine system and that efforts will focus on trying to identify and correct the main reasons why a test fails randomly.
For this reason, this RFC will be adapted accordingly to provide an analysis tool to help accomplish this purpose.
Solution
The proposed solution is a set of small pieces of software and changes. For simplicity, we will refer to all of these pieces as the watchdog of continuous integration.
The entry point and where the process will start is in the project's own Jenkinsfile:
node () {
    try {
        // test actions here
    } catch (err) {
        // slack message to devops
        throw err
    } finally {
        def summary = junit testResults: 'jenkins/testbos*.xml'
        def int failuresNumber = summary.failures as Integer

        if (failuresNumber) {
        {
            // upload_s3("jenkins/test*.xml")
        }

        if (currentResult == 'ABORTED') {
            // if it is a timeout, send message to automation team
        }
    }
}
Every time we have failed tests in the integration branch, we will store the results file in junit XML format. It is proposed to store the file in an S3 bucket, ordered by date and build number.
The method to store the files in S3 will be implemented in groovy, in the jenkins-devops repository.
Having stored the results files, we can have the analysis and treatment of the flaky tests decoupled from the continuous integration process in the tests.
The piece of software that will be in charge of managing the flaky tests, which we have called 'flaky_digester', will be in its own repository and will allow us to develop a powerful tool so that anyone can perform analysis on the results of these tests.
As this type of test result files is identical for any of the projects that use pytest, we can reuse this software for the main Ebury platforms: BOS, FxSuite and Ebury Online.
This is an example of the information in the junit .xml file:
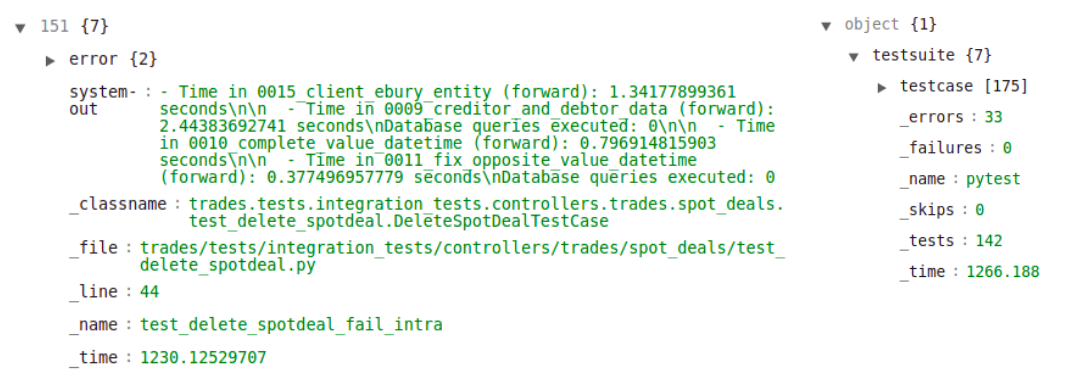
With this information, we can extract useful information to identify the main causes of flaky failures in integration tests, detect tests that frequently fail and slow tests.
The implementation of this system can go step by step, including the different parts proposed in different iterations. For example:
- Slack alerts for DevOps and Automation.
- Junit file storage in S3.
- Initial structure of the repository 'flaky-digester'.
- Automation of flaky_digester metrics.
S3 bucket configuration
- Configure a two-year life cycle for files stored in the bucket.
- Configure S3 bucket as S3 One Zone-IA to reduce costs.
- Key naming pattern should be: bucketname/branch/date/buildnumber/
Automated data extraction and visualization
The proposed architecture for the processing of watchdog data is described below.
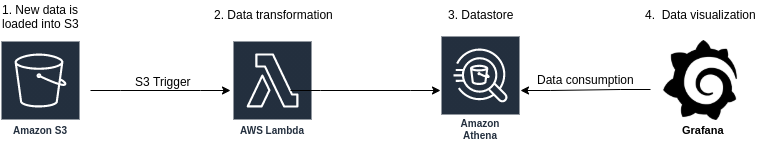
- The results file generated during continuous integration are stored in an S3 bucket.
- A lambda function is responsible to transform the data lake.
- Data is stored in AWS Athena format to later consume it from grafana.
- AWS Athena as a data source in grafana. In this way we would have all the CI metrics in the same place.
Purpose of the lambda function
The lambda function will be in charge of converting the xml and json data of each tetsuite into a flat format like csv, with which to create partitions in an AWS Athena database. The original data that has already been processed will be deleted from S3.
Cost estimation for the lambda function
Assuming that the CI in the integration branch is launched about 100 times a month and that each build contains 22 testsuite for integration tests, the lambda function will run about 2200 times a month.
The maximum resident set size on my laptop to process the three files of the largest testsuite is 36.664(Megabyte) and, the execution time on my laptop is 0.53s.
- The minimum memory allocation is 128 MB.
- The monthly compute price is 0.00001667 us dollars per GB-s.
- Total compute (seconds) = 2200 * (0.53s) = 116,6 seconds
- Total compute (GB-s) = 116,6 * 128 MB/1024 = 14.575 GB-s
Monthly compute charges = 14.575 * 0.00001667 = 0.00024296525 us dollars
This is a very imprecise estimate, but it helps to see that the costs will be low.
FAQ About data extraction/visualization
-
What metrics are we going to obtain? Mainly we are going to obtain two data: All the failures in the tests even if they are not shown in the results of the CI (flaky tests) and, the execution times of each test, with the focus of detecting the slowest tests. Additionally, other metrics, such as the percentage of growth of the test suite over time, can be interesting.
-
Why have we chosen this architecture? It is the architecture suggested by AWS in its documentation, it does not require maintenance and its operation and implementation cost is low. Still, any suggestions to improve it are welcome.
-
The CI seems quite stable at the moment. Is this development necessary? From my point of view, we need to visualize the state of the test suite to anticipate problems. This is a proposal to detect if someone introduces a new flaky test, or an excessively slow test.
-
Why not use prometheus to store and display the data? Because prometheus is not intended for this and this data is not time series. In addition, its implementation would be more complex since it would require an intermediate storage.
-
Why don't you use AWS Glue to transform the data? Because the minimum unit that is priced with GLUE is 10 minutes and, we don't need that much.
Alternatives
The Jenkins API can be used to extract similar data, but this has the drawback of putting a heavy load on Jenkins master nodes, which negatively impacts overall Jenkins performance and can cause the system to stop running.
The implementation of such a system requires knowledge about the operation of the continuous integration system and the possibility of creating custom software to carry out the proposal.
Caveats
By decoupling the analysis process proposed in this document from the operation of continuous integration, the impact on performance should be minimal.
Operation
The upload of the results file will be done after finishing each stage with failures. If there are no faults, no action will be taken.
The analysis of the data can be carried out at any time regardless of the operation of continuous integration.
Development and maintenance will be handled by automation team, error alerts infrastructure will be received by the DevOps team and acting on Flaky test shall be performed by the development team and QA.
This project is intended to be an internal use tool for Ebury's technology department.
Security Impact
It is recommended to create a specific user and an IAM role to allow working on the S3 bucket. This will be handled with the Security and DevOps department.
The permissions on the flaky_digestor repository will be managed according to the current ownership and permissions policy.
Performance Impact
The impact should be minimal and not affect the continuous integration process since this process will only be applied in the integration branch of the project and you will only have to upload a small file (less than 400kB) when there are failures in the tests.
Developer Impact
From an application developer's point of view, the process is transparent to him.
In the case of DevOps or automation team, they will receive alerts related to detected events that may be false positives. The intention of this is to identify possible improvements.
Data Consumer Impact
No impact.
Deployment
Following the philosophy of continuous improvement, as detailed in the Solution section, the implementation will be in steps. The involvement of DevOps or other departments should not be necessary beyond participating in the Pull Request review or providing infrastructure information.
Dependencies
No dependencies.
References
- Pytest flaky docs
- S3 API - PUT object
- Athena as Data Source in Grafana - Plugin
- How to add AWS Athena Data Source in Grafana 7 - Tutorial
- AWS Lambda
- Configure Amazon S3 to publish events
- AWS analyzing and visualizing example
- Build a Schema-On-Read Analytics Pipeline Using Amazon Athena
- Analyzing Data in S3 using Amazon Athena