Monitoring platform
Goal of this RFC is to propose architecture, processes and tools to reduce drag in extending application monitoring. This document is not aiming to be comprehensive tutorial on using proposed tools like Prometheus and Grafana.
Problem Description
In order to make decisions based on data, we need reliable data. At present we have several sources of information on what is happening in Ebury application (logs, checks, stack traces). Additionally, systems that we currently use (i.e. Nagios) are not always designed to work in dynamic, cloud environment. This creates problems in following areas.
Adding new metrics
Quantitative measurements are based on logs collected and processed in Kibana. Adding new metric requires extending log format. Text nature of logs restrict number of fields to at most few hundreds. Above this limit bandwidth and storage become a concern.
Data comparison
As information is collected in separate applications in different formats: Kibana, Munin, cloudwatch, Nagios. It makes comparing events against each other difficult.
Alerting
Our major alerting system Nagios doesn't support dynamic environment. Moreover as complexity of system grows, it's harder to have single person with fluency in fixing problems in each corner of system. Nagios, does not support notification logic based on problem source that allows spreading responsibility across teams.
Testability
Our visualisation tools, both Grafana and Kibana, have dashboards defined by hand. It makes introduction of changes and testing them substantially hard. Review and testing is essential to make data reliable. Current alerting system also is missing testing environment.
Background
Ebury application originates from set of Django applications running directly in operating system. It's natural that monitoring system was build around it using accessible tools. We have been using cloudwatch metrics and logs for getting quantitative data of infrastructure. Alerting system of choice was Nagios which was acting upon system health checks based on black box observations.
Logs aggregated in Kibana were also used to get insight into internal application state and performance.
Things are changing and Ebury application architecture started moving towards service oriented. Final stage of this transformation would be to deploy on Kubernetes.
In new environment gathered data started to be insufficient to understand process flow, prevent incidents and troubleshoot them during postmortems.
Solution
In order to make diagnostics of Ebury application easier centralised system for collecting and graphing data should be created. Based on already tested solution, Prometheus was proposed as a collecting metrics work horse.
Graphing data should be performed by well established standard tool Grafana. It allows dashboards provisioning and tools for dashboards-as-a-code are emerging.
Integral part of Prometheus ecosystem is a Alertmanager application which allows integration with already used notification routing platform VictorOps.
Grafana dashboards and alerting rules should be kept by the code and exposed by the service itself. This is mainly to address testability of both metrics and visualisations by promoting artefact from development environment to production.
New metrics collecting system is designed to complement rather than replace logs, while log messages are irreplaceable in high cardinality data.
Architecture
Ebury Application spans across several VPCs. As a consequence of not using VPC Peering, traffic between VPCs need to be secured at networking (firewall filters) and application level (SSL encryption).
Maintaining access rules in every service to allow connections from central Prometheus instance located outside VPC was not feasible. Thus federated model was chosen.
Each VPC has its own Prometheus instance responsible for scraping metrics from services based in his network. Network firewall allow access to federated node only from central Prometheus server. Connections between central and federated nodes are encrypted with SSL.
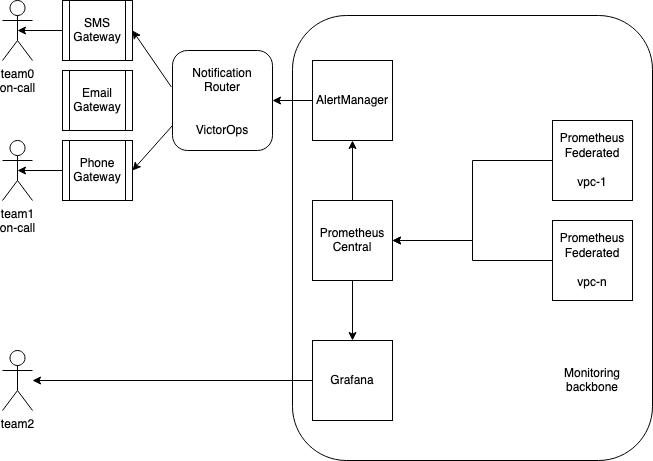
Pic 1: Bird eye view on architecture, arrows show data flow
Metrics
Prometheus philosophy revolves around pull model. This mean that process exposes endpoint where metrics can be scraped and Prometheus connects to service. Three types of data sources can be identified:
- Service running directly on EC2 exposing metrics in Prometheus format.
- Service running in container exposing metrics in Prometheus format.
- Service exposing metrics in format that can be scraped with Prometheus exporter.
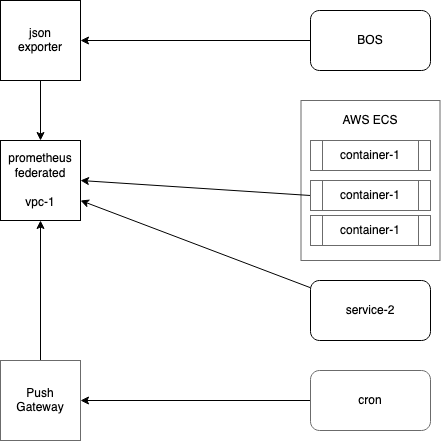
Pic 2: collecting metrics inside VPC
Collecting metrics
Already running metrics collection tool is a Prometheus. It fits our needs and has built in auto discovery mechanisms for both AWS Cloudwatch and Kubernetes. Prometheus searches for endpoints to scrape using tag Prometheus: 1 on both EC2 instances and ECS Services.
Each new service is required to expose metrics using Prometheus client library at TCP port 19100 at /metrics endpoint but not more than 5000 records.
Metrics are kept for 60 days.
Each legacy service needs to expose endpoint that return service key-value status in json.
[
    {
        "CeleryHealthCheck": "ok"
    },
    {
        "queue_automaticfundfrombalanceclient": "warning",
        "msg": "warning msg"
    },
    {
        "amazon_s3": "critical",
        "msg": "error msg"
    }
]
Authorization
Prometheus supports scraping metrics that are covered with authorisation. Following methods are supported:
- basic auth (user and password)
- bearer token (static and dynamic like oAuth)
What to measure
Each service should measure finite resources with proposed minimal set of metrics based on Four Golden Signals.
- request Rate
- request Error
- request Duration
- Saturation -- ie. how many elements are still in queue.
Other metrics can be added if needed as RED method is limited only to request-driven services. Host metrics should be instrumented with USE method.
Metrics type
Prometheus has two types of metrics known from other systems: gauges and counters. Third one is a special metric type used to track software version or system roles.
- gauges -- used to track memory and disk consumption.
- counters -- can be only incremented, handy when tracking requests throughput
- info metrics -- gauges with constant value 1 -- used when tracking service version
Naming convention
- Each metric is a lower snake case
library_name_unit_suffix libraryis a component name, not serviceunitis a basic unit used by Prometheus: seconds, request. Not always required.suffixused mainly for counterstotal.- Name of metric has to be unique globally.
- Don't put service name in metric name. Service name would be added in target labels.
An example of metric holding HTTP request counter for 200 OK: http_request_total{path="/api", method="GET", status="200"}
Info metrics
Service version number must be emitted as a info metric with name in format service_name_info{version=3.14.15} where version is a label.
Labels
Label is a key-value pair added to metric name. Each metric may have multiple labels assigned at two stages: infrastructure and instrumentation.
Instrumentation labels
Instrumentation label is a label added by application. Can be any internal application information that developer finds important.
Keep in mind that each label value creates separate time-series. This is main reason why variables with values of high cardinality should be written to logs rather than metrics.
http_request_total{path="/api",     method="GET", status="200"}
http_request_total{path="/status",  method="GET", status="200"}
http_request_total{path="/",        method="GET", status="200"}
http_request_total{path="/api/v1/", method="GET", status="200"}
Target labels
Infrastructure labels called target labels are added in Prometheus configuration. These labels usually mimic infrastructure architecture and there needs to be damn good reason to change them. SRE Team takes care of that.
Examples with possible values:
- env: dev, prod
- region: eu-west-1, us-east-1
Metrics validation
To make sure prometheus would be able to digest exposed metrics, validation can be performed with promtool (available in apt and brew repos):
curl -s http://localhost:9090/metrics | promtool check metrics
Exporters
Not always service naively supports metrics in Prometheus format. In such situations adapter called Exporter is used. It's a separate process that translates native metrics to format digestible by Prometheus. There a plenty of exporter types like: MySQL, RDS, cloudwatch, node.
Integrating service with Prometheus with use of an exporter should be treated as an exception. Each time it should be consulted with SRE Team as it requires additional configuration on infrastructure side.
Push gateway
Not all processes are running continuously and thus scraping is not feasible. Monitoring of periodical tasks like cron jobs, backups et al. can be achieved with help of push gateway. Process pushes metrics to push gateway and Prometheus scrapes it the same as it does with exporters.
Visualisation
Grafana is an established standard tool for graphing with native support for Prometheus. It also supports dynamic loading dashboards definitions without need for restart. Scraping dashboards definitions is designed in similar approach as Prometheus federated instances.
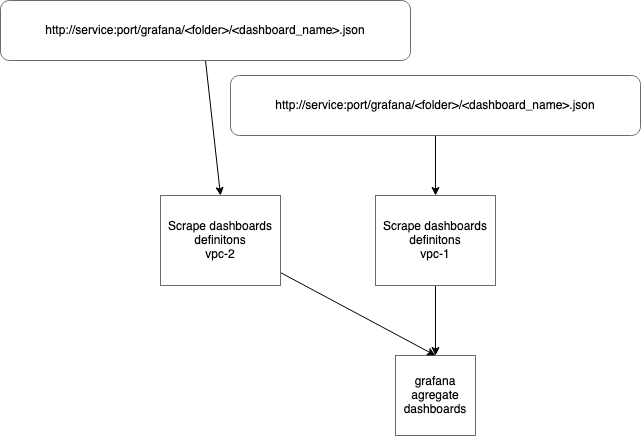
Services providing dashboards would be discovered by filtering EC2 instances and ECS Services for Grafana: 1 tag. Then dashboard would be fetched and put into Grafana server by automatic process.
Dashboards directory structure
Each service should have separate folder with at least dashboard called <service_name>-main that should fit on a single page without scrolling. Additional dashboards can be created as team see fit.
Dashboards as a code
Each service should expose list of Grafana dashboards definitions at port 19101 at endpoint /grafana in json format:
[
   {
      "dashboard_file": "dashboard_file_name0.json",
      "folder": "folder_name_where_dashboard_should_be_placed_in_grafana_server"
   },
   {
      "dashboard_file": "dashboard_file_name1.json",
      "folder": "folder_name_where_dashboard_should_be_placed_in_grafana_server"
   }
]
Service should serve static json file along with HTTP ETag.
It's up to team decision whether to use static json Dashboards or templating engine to generate dashboards. Suggested solutions:
Adding new dashboard
Developing new dashboard starts with ED2K environment where Grafana and Prometheus are present. Once dashboard is prepared in Grafana, it could be exported and stored in service code. Make sure dashboard is accessible via /grafana endpoint.
After review and tests on staging, dashboard is deployed to production along with new application version.
Alerting
Alerting is used to notify that metric values are out of defined margins. Based on rules Prometheus notifies alert manager that forwards message to notification router.
All alerts are required to have tests and link to handbook which describes how to react to this action and which team is an owner of this alert.
Alert states
Alert can be in three states indicated:
- ok -- metric within expected range, no action needed.
- warning -- metric out of ok-range but within warning-range. Something has to be done but not immediately, within defined period (ie. 8h). Always actionable.
- critical -- metric out of warning-range. An action needs to be taken immediately. Alert should be delivered even at night. Yep, it means waking up at 3:20 a.m.
False positive
There is one more condition that needs to be covered: false positive. It is a result that indicates a given condition exists, when it does not. As an example can be used warning alert that resolves itself after certain time.
False positives are severe problem as lead to increased noise level and notification fatigue. Both influence response time to real problems.
Alert as code
Alerts and service version release cycle may significantly differ thus their code should be kept in central repository. Each service would have separate directory for needed alerts. Alerts may differ between develop and prod environment so separate folders are needed for differences. Common cases are kept in common directory and deployed to all environments.
common/bos
develop/bos
develop/fxs
prod/bos
prod/fxs
Notification router
Main function of this component is to deliver notification about event. Based on predefined logic it also allows sending notifications to most relevant people. VictorOps provides following means of notification: instant messaging (slack), E-mail, SMS, Voice call.
In order to make sure alert is delivered escalation policy can be set. Additionally grouping users and teams and using calendar to schedule on-call allows effective rotation management.
Each alerting rule is required to define label team with value of team name (lowercase) that is going to be notified.
By default notification would be sent to channel named after label team or custom, provided by optional label slack_channel.
- name: Blackbox
  rules:
    - alert: BlackboxMetricsMissing
      expr: 'absent_over_time(up{job="prometheus-blackbox-http_2xx"}[15m])'
      for: 1m
      labels:
        severity: warning
        team: sre
        slack_channel: foofarbaz
      annotations:
        description: "{{ $labels.job }} job is not returning metrics for 15m"
Testing
Each alerting rule needs to be tested, both for positive and negative cases. Please take look at examples in prometheus documentation and in our repo.
Who monitors monitoring?
Even best monitoring can break. Prometheus has a build in alert called watchdog which fires every 10 minutes. There are external services that can notify alerting router when
check-in has not been received for defined period of time.
- https://deadmanssnitch.com/docs/integrations/victor-ops
- https://cronitor.io/pricing
- https://healthchecks.io/pricing/
Alternatives
dashboards code organisation
Alternatively to keeping Grafana dashboards definitions by the code is to have single centralised repository. This would require careful process of aligning service versions with dashboards versions to make testing possible.
Workflow
In order to make local development possible, Grafana and Prometheus container would be added to ED2K stack. This would shorten feedback loop while developing locally and improve quality by including both metrics definitions and Grafana dashboards in the same PR.
In order to address problem of testability and peer review, process of adding metrics should follow proven practices. It includes peer review and testing.
New metric would naturally added as code in service repository, but the same path should be followed by dashboards definitions.
Keeping definition of metrics and dashboards by the code would also mean that testing procedures can be applied. Promotion of only tested artifacts would increase reliability.
Operation
Monitoring platform as a framework would be provided and supported by SRE Team. Each team would be responsible for preparing metrics, dashboards and alert definitions.
Security Impact
Data exposed via /metrics endpoint are considered as sensitive. Access to it should be restricted to selected number of IP addresses.
Performance Impact
Overhead of used Prometheus library is negligible, but please keep in mind that by default Prometheus scrapes /metrics endpoint every 15 seconds.
Developer Impact
Developer impact is significant as in essence this RFC proposes shift from "DevOps deliver monitoring" to "DevOps deliver tools for monitoring but it’s up to development team to prepare what data to collect and how to interpret it."
With the creation, or adoption, of a service or application there will be 3 additional deliverables on top of the functional code:
- Metrics definitions
- Dashboards definitions
- Alerts definitions
Exposing metrics would require including Prometheus library and designing metrics itself. Designing metrics mean figuring out what you want to measure and adding code that use Prometheus library.
Additional work would be needed also in space of visualisation. New metric would be graphed only if development team would prepare Grafana dashboard for it. This dashboard would be exposed by service itself and collected by external service to be presented in Grafana.
Data Consumer Impact
Does not have impact.
Deployment
Adding instrumentation to services and development of scraping platform can be done independently. As a first step was planned extending ED2K with Prometheus and Grafana which would allow working on services.
While metrics being added to services, Prometheus discovery mechanism need to be added for ECS Clusters.
At first stage service discovery for Grafana is not needed as we can have a static list of services that expose dashboards. Implementation of dashboard definitions scraping method can be moved to later deployment stage.
Dependencies
No dependency was identified.
References
Epic covering monitoring platform development: DVO-3612
Changelog
1.1.0
- Add requirement for alerting rules to define label
teamwith vale of team name that needs to be notified about alert. - Add requirement for testing alerting rules.
- Explain how to handle scraping metrics when authorisation is required.
- Add validation method for metrics.
0.0.1
pre release version